NUC AI Lab · Local service operations
As your local AI setup grows, use a dashboard to manage your Local LLM API keys
More machines mean more endpoints and API keys. I built a dashboard to keep them together and see the current state of each service.
More machines meant more endpoints to keep track of
I set up GX10, ROG NUC and other machines to provide local model inference. The computer using a model is not necessarily the one running it. Once the models were working, keeping track of URLs, API keys and each machine’s current state became a problem of its own.
The frustrating moment is when a client suddenly cannot connect. Is its configuration wrong? Has the model service stopped? Or is the compute machine offline? Looking up endpoints and checking machines interrupts the task I actually wanted to do.
I wanted an answer to a practical question: which services are available, and where should I start if one is not?
Put the endpoint and its status in the same place
I built a dashboard to organize model services with OpenAI-compatible APIs. It brings connection information and the required keys together with model and service status, so I have fewer settings screens to search through.
The dashboard polls every 60 seconds. That makes it a near-real-time view: it represents the latest observation, not an instant guarantee. When something looks wrong, I check the update time before deciding what to do.
I care about more than a green or red light. A reachable server, a loaded model and a successfully completed request are different states. The interface should help me distinguish them.
What the interface can tell me today
The summary separates running, standby and offline services. Model cards show the model name, context information and whatever load metrics a service provides. The captured view includes in-progress requests and KV cache usage. Missing data stays missing; it is not treated as zero.
I also want visibility into queues, but an in-progress count is not a complete waiting queue. Runtimes expose different fields, so I need to understand each number before using it.
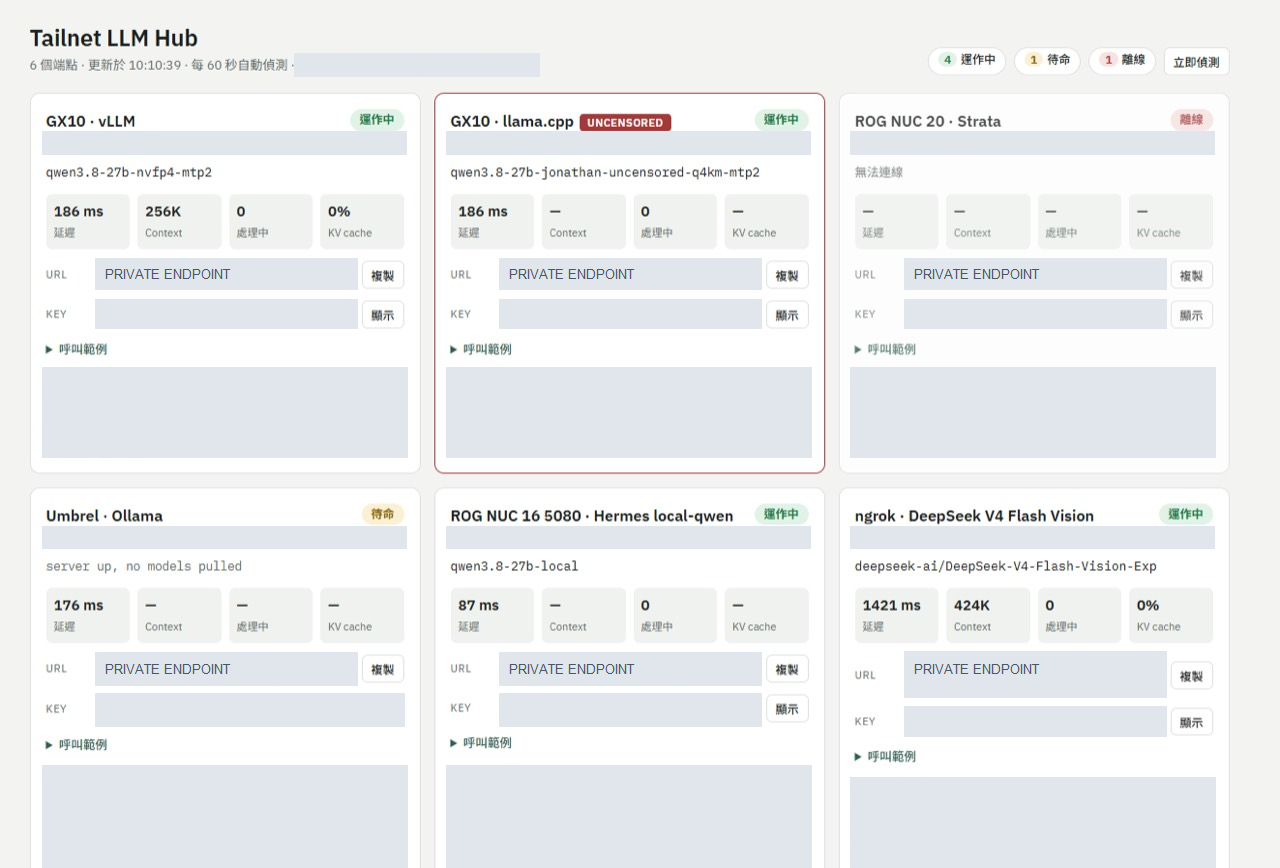
Select the image to view it at full size. The original Chinese interface is preserved. Values are a momentary snapshot, not benchmark results.
Separate the layers before changing things
I included SSH connection status because cross-machine troubleshooting involves more than the model API. I want to know whether a management connection is available and whether authentication succeeds. Working SSH does not prove the model API works, and a working model does not prove SSH is configured.
When a problem occurs, I check the recent status and then the detection log to narrow down where to look. These are troubleshooting signals, not an automatic root-cause diagnosis.
- Check the update time. If it is stale, first check whether monitoring itself is still running.
- Check the model service. Distinguish offline, standby and load, and verify the endpoint configured in the client.
- Check SSH status. Separate device connectivity, management permissions and model service issues.
- Compare the detection log. Investigate the suspect layer instead of resetting everything at once.
Available on my phone, without making the dashboard a public site
I host the web server on a machine intended to stay on around the clock. An authorized phone or everyday computer on my Tailscale network can open the dashboard through its provided DNS name, without sitting in front of the compute machine.
Tailscale gives me a private-network access path, reducing the need to expose services directly to the public internet for remote use. DNS names make access easier to remember; connectivity and permissions still determine who can use it.
There is an important boundary here: the dashboard’s access scope is not automatically the access scope of every listed model endpoint. Other public entry points and permissions must be checked for each service separately.
What building a dashboard does not solve
Its current value is a shared starting point for information that used to be scattered. I have not measured before-and-after troubleshooting times, so I cannot claim a percentage improvement. Displayed latency is not a model generation-speed benchmark.
Minute-by-minute polling can miss brief failures between observations. A context field does not mean I have verified reliable inference at every length. Keeping a machine powered on is a deployment choice, not a high-availability commitment.
Organizing API keys in a dashboard does not make it a complete secrets-management system. Storage, display permissions and rotation still need their own review, and shared screenshots must exclude identifying and credential information.
Next, I want to learn whether it helps in practice
I want to record real connection incidents: how long it takes to notice a problem, how long it takes to locate the failing layer, and which fields actually help. If there are more numbers without easier decisions, the interface needs revision rather than more charts.
Clearer stale-data indicators, notifications and documented field definitions for each runtime are directions to explore. They are next steps, not completed features.
For me, this is a small part of bringing local AI into everyday work: beyond getting a model to run, help the person using it understand what to do when it stops working.